A critique of Nominal and Real macro Unit Labour Costs as an indicator of competitiveness
Download the WEA commentaries issue ›
By Merijn Knibb
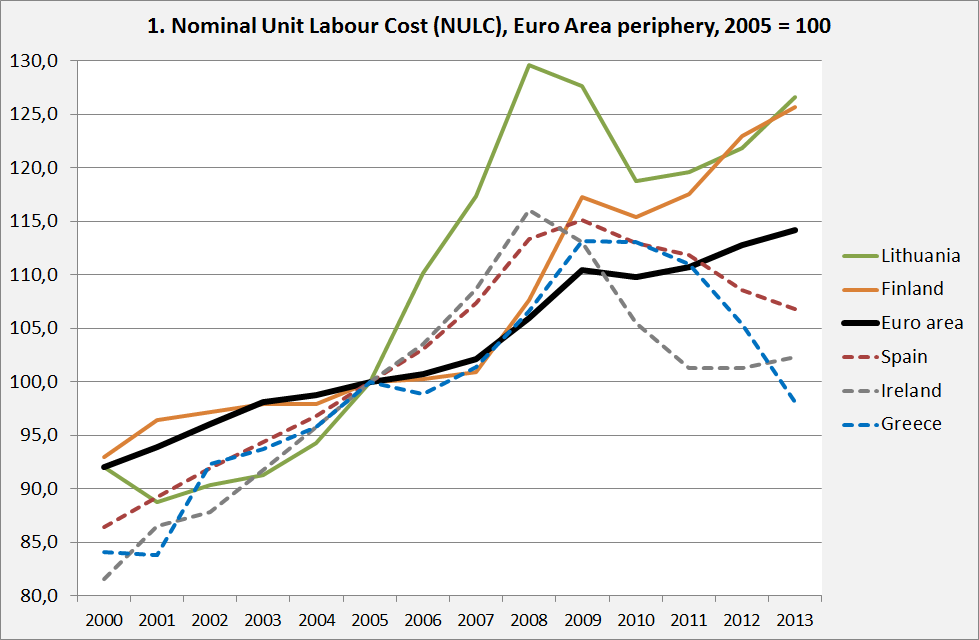
‘Unit Labour Costs’ (ULC) are a staple of macro-economic statistics. As a measure of labour costs per unit of real GDP they are calculated by the OESO, Eurostat and the Bureau of Labour Statistics and they figure prominently on the website of the ECB. They are also one of the core variables included in the Macro-Economic Imbalance Procedure of the European Union which indicates their political significance. After about 2009, Eurozone countries were under strong pressure to decrease their ULC, at least relative to other countries, as (relatively) high ULC were understood to be a sign of low competitiveness. Look here for a Draghi Speech which states this. The preferred way to decrease ULC was to moderate or halt wage increases or even to slash wages. However, there might be something wrong with this line of thinking. Graph 1 shows that after 2008 some countries indeed managed to lower ULC (in this case: Nominal ULC or NULC, see below), not just relative to other countries but even in absolute sense. But was this caused by keeping wage increases low or even by lowering wages? Graph 2 (see over) shows that Greece and Ireland, which witnessed a comparable total decrease in NULC, had a radically different development of wages.
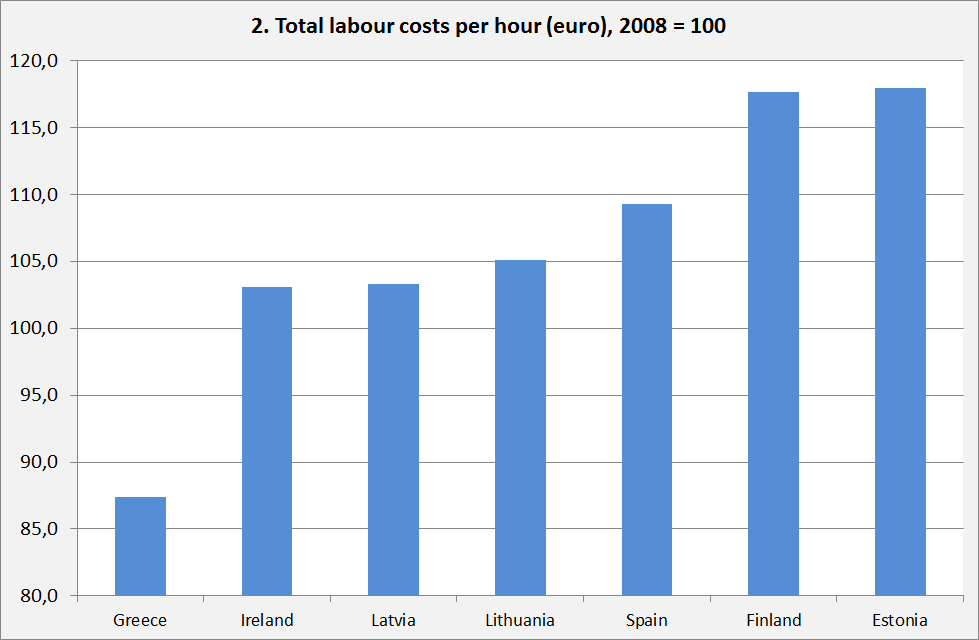
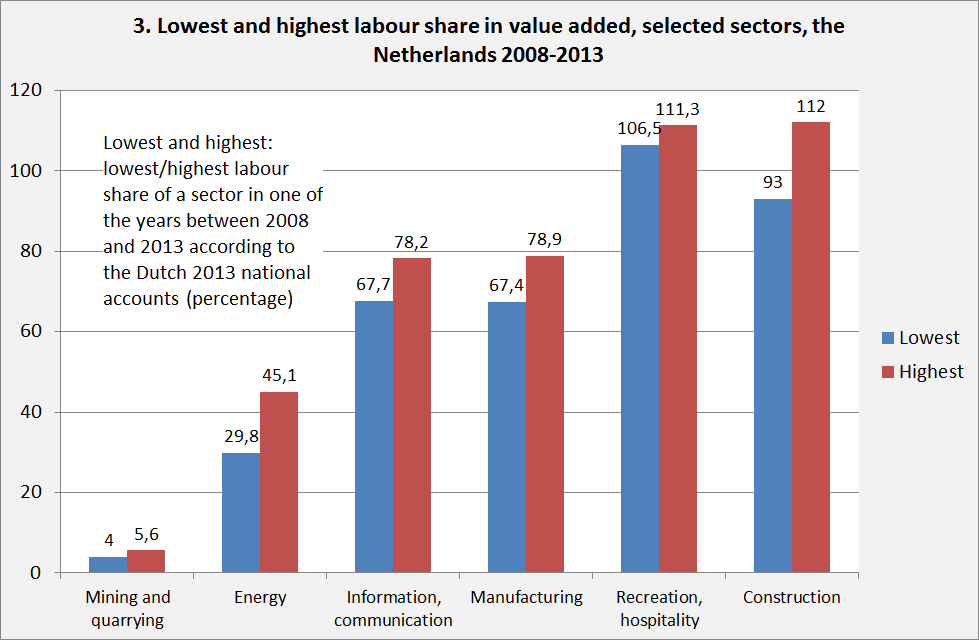
This suggests that other factors were important, too. Might wholly different developments lead to comparable changes in NULC? If this is the case, can NULC still be understood as a valid indicator of competitiveness? Below, these factors will be investigated and it will be argued that NULC should not be used as an indicator of macro productivity and competitiveness. On the micro level, wage costs per unit of product – such as wage costs for installing a solar panel – are indeed an important indicator of productivity. However, on the macro level this is not the case. GDP (the denominator in the formula) is an aggregate based upon the aggregation of sectors with wildly different labour costs (see graph 3 below). These sectors are aggregated using weights which, because of Schumpeterian dynamics or booms and busts, can change quite fast. This can lead to changes in NULC which are sometimes even in the opposite direction to changes in wages levels! Also, many of these sectors have next to no connection with the competitiveness of an economy. Importantly, competitiveness is only to a very limited extent dependent on the wage level (see this ECB task group study or Felip and Kumar (2011)). Consequently, while ULC might be useful to compare individual companies, they are not fit to compare countries. There are many reasons for this. Felip and Kumar do a good job debunking the use of this metric. However, their list of reasons is far from exhaustive and I’ll try to complement it.
To do this, I first have to explain how ULC are calculated. Eurostat provides us with the following definition:
The unit labour cost (ULC) is defined as the ratio of labour costs to labour productivity.
Nominal ULC (NULC) = (D1/EEM) / (B1GM/ETO) with
D1 = Compensation of employees, all industries, current prices
EEM = Employees, all industries, in persons (domestic concept)
B1GM = Gross domestic product at market prices in millions, chain-linked volumes reference year 2010
ETO = Total employment, all industries, in persons (domestic concept)
In other words, NULC are nominal labour costs per employee divided by real average value added (GDP) per worker. Eurostat continues with the caveat: “Please note that the variables used in the numerator (compensation, employees) relate to employed labour only while those in the denominator (GDP, employment) refer to all labour, including self-employed. “ It is a crude approximation for the share of GDP going to workers.
This definition leaves us with the following conceptual problems:
- It is an indicator which contrary to many statements should increase, considering stated policy goals. Imagine a country with (like the Eurozone) an inflation target of 1.8% but which (unlike the Eurozone) does not target consumer price inflation but the GDP deflator. Such a level of inflation cannot be sustained when, in the medium run, wages do not increase by at least the same percentage (in fact: a slightly higher percentage, assuming some increase of labour productivity). The idea that NULC have to be stable is not consistent with the inflation target of the central bank – the low increase of German NULC before 2010 should have been a cause for concern and sorrow for the ECB!
- The Eurostat caveat above is significant. The use of employees in the numerator and all workers in the denominator means that countries which had a large share of self-employed which left this status to start to work for wages which are about as high or slightly higher than their previous ‘mixed income’ as self-employed (e.g., a shift out of peasant farming and into tourism in Greece) might see an increase in NULC, because of structural modernization! (In extreme but conceivable cases this won’t happen when, thanks to this shift, GDP (the denominator) rises relatively faster than total wage income (the nominator) because of a very rapid increase in net capital income – a case would be a shift of labour from peasant production to the extraction of natural gas (see also below)).
- A related problem exists because of differences between economic sectors. Ireland is an example. The bust of the building boom led to the demise of lots of industries with relatively high ULC’s while industries with a low ULC and a high share of capital, like the pharmaceutical industry, were much less affected by this bust. As a result, the average ULC of Irish industry declined – while the ULC’s of subsectors of Irish industry barely changed. Talk about a fallacy of composition! Do not underestimate the magnitude of these differences. Graph 3 shows the labour share in value added for economic sectors in the Netherlands (which I took as I had the data at hand and also because of the exceptional low labour share in the natural gas sector). Differences are clearly very large (the 4% for mining and quarrying, aka natural gas, is real) and show large changes while for some sectors the labour share can even be more than 100%, especially in sectors with many self-employed, who, according to the formula, are assumed to earn the average wage. Often, however, they earn less. This is because of the accounting assumption that the wage income of the self-employed is ‘average’.
It means that their high labour share is compensated by negative profits (i.e. losses).Applying such ideas: the decrease in NULC in Greece was probably caused by lower wages but the Irish decrease was to a large extent caused by the bust, which caused construction (which has high NULC) to decline. Two totally different events show up in the data in the same way! - Non-tradeables. Between 2000 and 2011, average German wages did not rise much. Consequently there was a low increase of the German macro ULC. But to quite some extent this was caused by stable nominal wages (and falling purchasing power) of teachers. Wages in industry rose a little more than average and Germany still is one of the few countries where industrial wages are higher than economy wide average wages (even despite very high wages in the financial sector). But do decreasing real wages of teachers really increase the international competitiveness and exports of a country? It might affect the current account as German teachers will have had to restrain consumption of, among other things, imported products. But at least for me the relationship with gross exports is not readily apparent.
- Felip en Kumar (2011) mention the Kaldor-paradox: the empirical evidence about the ULC and competitiveness in fact suggests that high increases in ULC do not cause a decline in competitiveness but are, on the contrary, a sign of successful export performance.
- Another fallacy of composition. An individual firm can increase its competitive position by cutting the wage level as the wages it pays (almost) do not affect the demand for its products. But when every company decreases wages total demand will suffer. Greece (where nominal wages have decreased by about 20%) is an extreme example of this. Low rates of capacity utilization and the accompanying decrease in productivity may prevent the decline in NULC and improved competitiveness.
- Global supply chains. The share of ‘domestic’ labour in the cost price of tradeable products shows sustained declines. Giordano and Zollino mention that the ‘domestic labour share’ of Germany declined from 27% to 21% of gross output (not the same as value added, the concept used to calculate GDP!) while the Italian share declined from 21% to 18%. This means that lowering domestic wages has a more limited effect on total production costs than it used to have.
- Owner occupied houses are, with good reason, supposed to add to total GDP. Household labour is however not counted in the GDP accounts, which means that, according to the OESO (p. 15) “in the case of Ownership of Dwellings there are no employees, and so this component of value added has nothing to do with the relationship between output and labour costs. Consequently, it should ideally be removed from calculations of ULC indexes… If included it has the potential to distort the comparability of ULC indexes across countries, in particular where there are large differences in the level or, more importantly, changes over time across countries in the contribution of Ownership of Dwellings to value added”
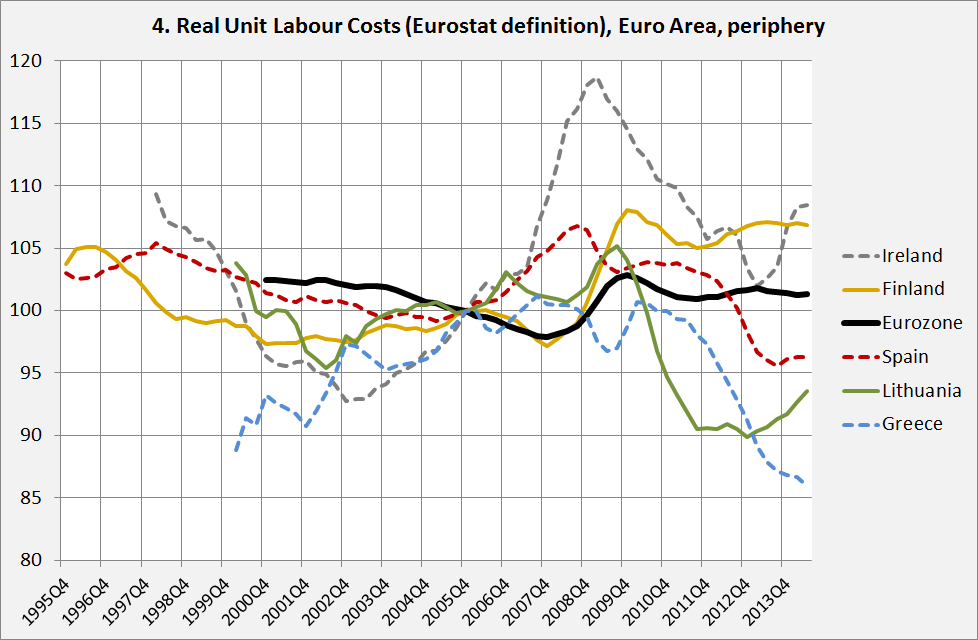
- Aside from NULC we have RULC, Real Unit Labour Costs. According to the IMF these are defined as either: “the ratios of real wages to productivity, labor compensation to nominal GDP or nominal unit labor costs to the GDP deflator. “ In all these cases it is (something like) the labour share in the economy. Though interesting in its own right (graph 4) this metric is of course bound to have limited variabilility (as is shown in the graph) while it is, as an indicator of competitiveness, prone to the same problems as the NULC (an increase of the production of natural gas in the Netherlands will lower the RULC, an increase in construction will increase RULC). Graph 4 however does show that the ‘program countries’ were forced to lower RULC to unnatural low levels – which however did not lead to the expected upsurge in investment.
Summarizing: ULC are a seriously flawed macro-indicator of competitiveness, much better ones are available, such as the composite one proposed in this ECB study. ULC cannot be used without a very thorough investigation of the actual situation and the background statistics. This has not happened post 2008.
All data: Eurostat.
From: pp.5-7 of World Economics Association Newsletter 5(3), June 2015
https://www.worldeconomicsassociation.org/files/Issue5-3.pdf