The Irish anomaly. Rethinking the concept and operationalization of ‘Gross Fixed Capital Formation’
Download the WEA commentaries issue ›
Summary. The 2019 Irish rate of Gross Fixed Capital Formation (GFCF), commonly known as ‘fixed investments’, was extreme. While a rate of 20 to 25% of total GDP expenditure is common, the Irish rate was over over half of total GDP expenditure (other items are for instance consumption and non GFCF government expenditure). This article will argue that this extreme rate was caused by an artefact of the recent change of the formal operationalization of GFCF in the national accounts, in combination with the position of Ireland as an international hub for property and profit shifting by multinationals trying to minimize taxes. The Irish data surely capture an important development, as also noticed by Irish national accounts statisticians. But it seems wrong to classify this rather unique development as GFCF. It might be better to roll back the recent conceptual change of the national accounts and to introduce a new variable to measure the property and profit shifting development mentioned above (suggestions for an apt phrase to capture this are welcome). This will enable an easier and more clear-cut interpretation of GFCF as well as the property and profit shifting behavior of multinationals.
- In 2019 Irish Gross Fixed Capital formation (GFCF) was, historically, extraordinarily high, as also noted by the CSO (Central Statistical Office) in its comments on the national accounts (figure 1). The series in ‘constant prices’ reached a level of about ten times the 1995 level and about twice the 2015 level, which was a record already.1 The phrase, ‘constant prices’ is put between parentheses because these prices are not constant. Often, they are only constant for two subsequent years, more or less leading to an overlapping system of short term, two year ‘constant’ series which are subsequently spliced. The ‘volume’ of 2018-2019 measured in constant prices of for instance 2019 is spliced to the ‘volume’ rate of 2019-2020 measured in 2020 prices. Remarkably, this procedure can yield rather robust results even when the interpretation of these results is not easy because of the continuous change of ‘constant’ prices.2 It might well be that the composition of GFCF in Ireland in 1995 was quite different than in 2019! But even when we take such considerations into account the Irish level was extreme.
Figure 1. Gross Fixed Capital Formation in Ireland, constant prices.

Source: ONS, internet 1.
- The extreme level of GFCF also shows when we compare the Irish level with the level in other countries by expressing it as a share of nominal GDP (figure 2).3. The Japanese rate during the years of Japanese hypergrowth was quite high too, but never surpassed 40%. This rate is however based on the ‘old’ concept of GDP-investment. The new concept also includes Research and Development and the purchase of military equipment. If these were included it might have reached or even surpassed 40%, compare Japan 1 and Japan 2. But even when it was a little over 40% it comes nowhere near the Irish level. Think about it: over half of all Irish GDP-expenditure consisted of fixed investment, leaving less than half for household and public consumption, including non-investment related health care, military and education related expenditure (mainly: wages), and net exports. Interestingly, the relatively high levels of many countries in the sixties and the seventies were, even when these where far below 50%, not tenable in the eighties and nineties anymore. Whenever after around 1980 countries had investment rates comparable with those in the sixties and early seventies, often related to construction booms, these were followed by severe financial crises. Think of Spain, Sweden, Japan, Finland and, indeed, Ireland itself. This, however, has not yet happened after the recent ‘Irish Anomaly’. Which means that we do not just have to look at the anomaly itself but also at the way it was financed. To summarize this: looking at historical and comparative data leads to the explorative question: ‘whatever happened with Irish GFCF in 2019?’
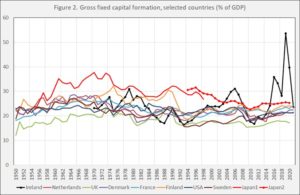
Sources: Eurostat (all countries except Japan, the UK and the USA after 1995), Central Statistical Office (CSO, Ireland before 1995), ONS (Organisation for National Statistics) (UK), CBS (Centraal Bureau voor de Statistiek) (Netherlands 1950-1994), Riksbank (Sweden 1950-1994), Bureau of Economic Analysis (USA), Cabinet Office (Japan). Insee (France before 1995). Finland and Denmark before 1995: Mitchell, B. (2005), International historical statistics 1750-2000 (Routledge).
- The 2019 Irish rate was extraordinarily high – however we look at it. Previous high levels have been caused by either periods of hyper growth (Japan, the sixties and the first half of the seventies) or construction bubbles. At this moment, there is neither hyper growth in Ireland nor any kind of construction bubble while the level is higher than during bubbles of periods of hypergrowth anyway, which leads to the question of the composition of GFCF: what is the composition of GFCF in Ireland? Figure 3 dissects Irish GFCF in a simple way, by making a distinction between ‘Intellectual property’ GFCF and all other GFCF (construction, machines, military equipment, whatever). GFCF in ‘Intellectual property’ alone reached a level of 40% of GDP, a level not reached in any of the countries shown in figure 2 for total GFCF. What happened? Two things.
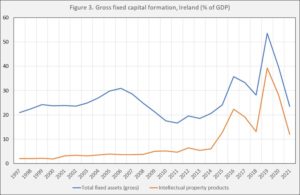
Source: Eurostat.
The first event was a change in the operationalization of GFCF by national accounts statisticians. According to the latest version of the national accounts manual, GFCF is operationalized as expenditure on new fixed capital, including purchased intellectual property products. According to the manual,
“The following types of gross fixed capital formation are distinguished:
(1) dwellings;
(2) other buildings and structures; this includes
major improvements to land;
(3) machinery and equipment, such as ships, cars
and computers;
(4) weapons systems;
(5) cultivated biological resources, e.g. trees and
livestock;
(6) costs of ownership transfer on non-produced
assets, like land, contracts, leases and licences;
(7) R&D, including the production of freely available R&D. Expenditure on R&D will only be
treated as fixed capital formation when a high level of reliability and comparability of the estimates by the Member States has been achieved;
(8) mineral exploration and evaluation;
(9) computer software and databases;
(10) entertainment, literary or artistic originals;
(11) other intellectual property rights.”
The manual continues:
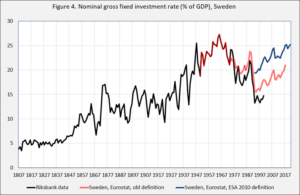
“Intellectual property products are the result of research and development, investigation or innovation leading to knowledge, use of which is restricted by law or other means of protection. Examples of intellectual property assets are: (a) results of R&D; (b) results of mineral exploration, measured as the costs of actual test drilling, aerial or other surveys, transportation, etc.; (c) computer software and large databases to be used in production for more than one year; (d) entertainment, literary or artistic originals of manuscripts, models, films, sound recordings, etc.” while the value of the assets includes fees paid to a former owner.4 Note that R&D as well as its results are classified as GFCF. Including intellectual property and Research and Development in the concept and operationalization of GFCF was not the only change. The ESA 2010 also included purchases of military equipment in investments GFCF, too, while related changes were made to the concepts of public consumption and the like. A detailed overview of the changes plus the consequences for the Greek national accounts is provided by Bragoudakis and Papadogeorgis, showing that, generally, changes were for Greece, compared with estimates based on the earlier ESA 1995 manual, not inconsiderable but also not dramatic.5 The average level of Greek GFCF increased by 0.8% (while the sharp decline of GFCF after 2009 was, if anything, underscored when using the new concept). For Sweden, a high ‘Research and Development’ country, it led to an upward revision of GFCF of around 4.5%-point (figure 4), which is quite large, but still way below the Irish level. So, what was special about Ireland?
- Some (anonymous) statisticians of the Irish CSO have written a concise analysis of the institutional and statistical background of the Irish Anomaly (internet 1). Part of their findings are shown in figure 5
Figure 5. Profit, Compensation of Employees and Profit shares of different institutional sectors in Ireland
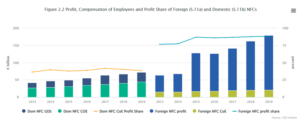
Source: internet 1
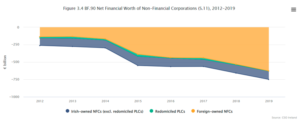
NFC stands for Non-Financial Companies, CoE stands for Compensation of Employees while Dom NFC GOS and Foreign NFC profit stand for the amount of profit (billions) earned by domestic and foreign companies. It can be seen that wages paid (total) by foreign owned companies are much lower than wages paid by Irish companies while the opposite holds for profits. At the same time (not shown in this graph but in the article) the investment rate of foreign companies is way higher than the investment rate of domestic companies. About this the Irish statisticians state: “This … has been driven by foreign-owned NFCs moving intellectual property (such as patents) to Ireland, usually as an company here purchases it from another company in the group.” The question remains how this was financed. The answer is simple. To quite an extent, intra-company payables and receivables were used. An example: Microsoft USA sells its patents to Microsoft Ireland by accepting the IOU emitted to Microsoft USA by Microsoft Ireland. It’s that simple. As profits are channeled abroad, this leads to ever more indebtedness of the foreign owned companies in Ireland (figure 6). Despite their very high profits and profit share foreign owned companies in Ireland become ever more indebted.
Figure 6. Net financial worth of domestic and foreign corporations in Ireland
- Traditionally, economists ascribe a dual nature to Gross Fixed Capital Formation. A short term nature in the sense that it’s part of the flow economy and total expenditure. An increase leads to an increase in expenditure and employment and production while decreases lead to lower expenditure and lower employment and production. Next to this, investments have a medium- and long-term nature in the sense that, when the right mix of private and public investments exists, it will lead to increases in productivity and maybe, when investments engender new possibilities and new investments, a shift the technological production border. This, of course, does not always happen. I’ve already mentioned construction bubbles leading to financial crises. And a build-up of the military arsenal does not, in any direct sense, lead to an increase of productivity (even when it might lead a change in the technological production border). But despite this, fixed investments often also do lead to productivity change and new production possibilities, while the short-term effect is, or at least was, undisputed.
- To capture more of the productivity enhancing effect of fixed investment, the ESA 2010 national accounts manual states that Research and Development and Intellectual Property should also be seen as investments and fixed assets. The Irish example, however, shows that sometimes ‘financial wizardry’ runs havoc with this idea. Patents should not be seen as ‘fixed assets’ like planes or ships, but as financial assets. In-company shifting of these financial assets from one country to another country does not lead to any kind of productivity increase inside these companies. Understanding patents and other intellectual property products as ‘fixed assets’ instead of as financial assets leads to estimates of GFCF with a different short- and long-term nature than usually ascribed to GFCF, therewith obfuscating the accounts. The measurements as such are sound (and indeed, as the Irish statisticians show, illuminating). But they can’t be understood as additions to total short term ‘flow’ expenditure which leads to work and production. Or as investments in new productive capacity which might enhance future productivity.
So, what to do? Clearly, on the one hand something interesting is going on which indeed should be captured by the national accounts. But on the other hand, present developments in Ireland disable the traditional reasons to distinguish CFCF, or fixed investments, as a distinct category in the national accounts. Inter-company international shifting of property titles, financed by issuing ‘payables’ by in this case the Irish part of the company which are accepted as ‘receivables’ by the USA part is a financial transaction, not fixed investment. The simplest but not simple way to deal with this is to reclassify these kinds of transactions as financial transactions and financial assets instead of ‘real’ transactions and fixed assets. The main reason to trade them is to shift wealth and financial claims from one country to another, not to boost productive capacity. Research and Development should however not be reclassified and should stay included in GFCF. This would, however, necessitate to an imputed account of ‘Research and Development capital’ not tied to ownership of patents – which is not that easy.
A more complicated solution might however be warranted. The national accounts are exactly that: national accounts. It’s complicated, but it would be nice if these are complemented with accounts showing shifts and changes in international property relations of large companies. The consolidated total international value of patents, 3.not the country where ownership is registered, would become paramount for productivity analysis. Even when information on taxes and wages will be national. Together, this would enable a clear analysis of the influence of profit shifting on international financial flows.
_________________________________________
- In this article, I will use some ONS graphs, partly because it’s convenient and partly to show the way the ONS treats these data. New in this article are the systematic historical and international comparisons and the discussion about the concept of Gross Fixed Capital Formation.
- Knibbe, M. (2020). Macroeconomic measurement versus macroeconomic theory (Routledge); especially chapter 8.
- A comparison with the ‘Penn’ series on GFCF and GDP, which are expressed in constant prices, yields that there are quite some differences in level between the GFCF rate in constant prices and the GFCF rate in nominal terms, i.e. using (as far as possible) prices which were actually paid. Knibbe (2020).
- Eurostat/European Commission (2013). European System of National Accounts. ESA 2010 (European Union), pp. 74-75.
- Bragoudakis, Z. and Papadogeorgis, I. (2014). ‘New National Account Methodology and the Implications for the Greek Economy: ESA 2010 vs ESA 95’. Available at SSRN:https://ssrn.com/abstract=3127544
- They also state, not the subject of this article, “The largest part of their impact is net profit, which, as mentioned, flows out to the rest of the world as dividends and reinvested earnings. The next largest element is consumption of fixed capital or depreciation, which is included in Ireland’s gross national income.”.
From: pp.8-12 of WEA Commentaries 12(2), August 2022
https://www.worldeconomicsassociation.org/files/2022/09/Issue12-2.pdf
Capital formation as well as production should be able to be described in terms of Popper’s World 1. A novel is a resident of World 3, although when it first appeared in the world, it was a resident of World 1 as well. It is this World 1 product (the original of the novel) that national accounts statistics should record as production and capital formation. Copies of the book containing the novel belong to world 1 and publishing companies (printing companies) have some fixed capital for the publication. This is another aspect to be addressed by national accountants.
Unfortunately, the present SNA rules involve some confusion between capital and rights. Irish anomaly is a typical consequence. Patents and copy rights are not capital but rights. It is perhaps right that R&D activities are treated as capital formation and they are evaluated by the cost borne. Because of the cumulative character of R&D activities, there may be stock concepts of R&D as well as R&D flows. Thus, a measure of R&D stock may be measured as the sum of R&D expenditures appropriately depreciated. Furthermore, their achievement may be inherited to another economic agent that succeeds to the activities. By purchasing a patent right concerning a particular R&D achievement, you can get a certain exclusive right. But your R&D stock level is as it was before. Of course, R&D stock of the economic agent that sold the right is lower than before because of the originality of the research becomes lower. In fact, when patent rights are authorised, the R&D stock of the original economic agent will be reduced, for, the knowledge in question was put to the public domain (World 3).
Capital formation as well as production should be able to be described in terms of Popper’s World 1. A novel is a resident of World 3, although when it first appeared in the world, it was a resident of World 1 as well. It is this World 1 product (the original of the novel) that national accounts statistics should record as production and capital formation. Copies of the book containing the novel belong to world 1 and publishing companies (printing companies) have some fixed capital for the publication. This is another aspect to be addressed by national accountants.
Unfortunately, the present SNA rules involve some confusion between capital and rights. Irish anomaly is a typical consequence. Patents and copy rights are not capital but rights. It is perhaps right that R&D activities are treated as capital formation and they are evaluated by the cost borne. Because of the cumulative character of R&D activities, there may be stock concepts of R&D as well as R&D flows. Thus, a measure of R&D stock may be measured as the sum of R&D expenditures appropriately depreciated. Furthermore, their achievement may be inherited to another economic agent that succeeds to the activities. By purchasing a patent right concerning a particular R&D achievement, you can get a certain exclusive right. But your R&D stock level is as it was before. Of course, R&D stock of the economic agent that sold the right is lower than before because of the originality of the research becomes lower. In fact, when patent rights are authorised, the R&D stock of the original economic agent will be reduced, for, the knowledge in question should be treated as if it was put to the public domain (World 3).
Correction included in the last sentence only.