Doubtful significance
Download the WEA commentaries issue ›
By G M Peter Swann gmpswann@yahoo.co.uk
In the February issue of this newsletter, Steve Keen (2012) makes some very good points about the use of mathematics in economics. Perhaps we should say that the problem is not so much the use of mathematics as the abuse of mathematics.
A particular issue that worries me is when econometricians make liberal use of assumptions, without realising how strong these are.
Consider the following example. First, you are shown a regression summary of the relationship between Y and X, estimated from 402 observations. The conventional t-statistic for the coefficient on X is 3.0. How would you react to that?
Most economists would remark that t = 3.0 implies significance at the 1% level, which is a strong confirmation of the relationship. Indeed, many researchers mark significance at the 1% level with three stars!
Second, consider the scatter diagram below. This also shows two variables Y and X, and is also based on 402 observations. What does this say about the relationship between Y and X?
Figure 1
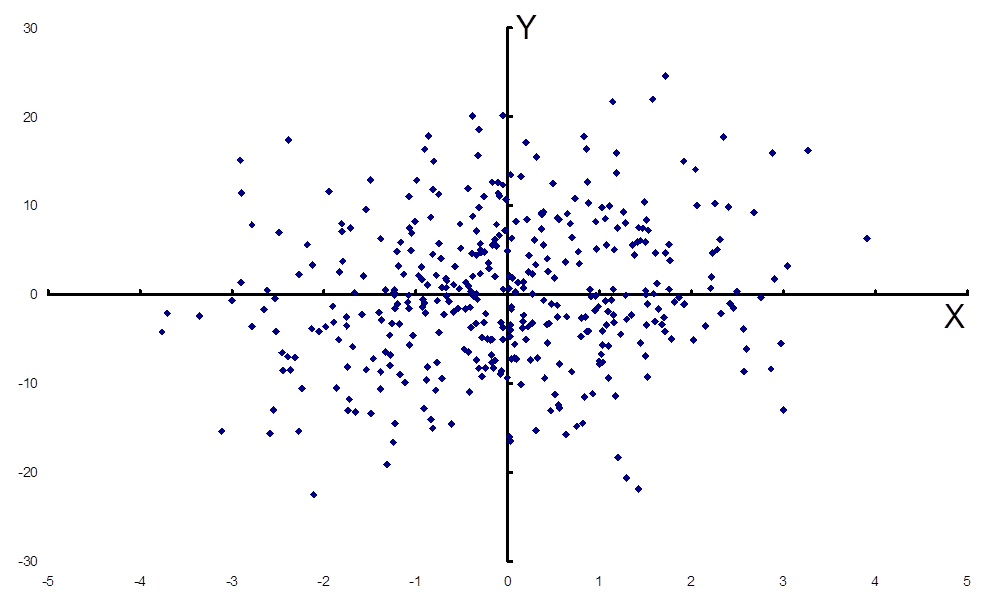
I have shown this diagram to several colleagues and students, and typical reactions are either that there is no relationship, or that the relationship could be almost anything.
But the surprising fact is that the data in Figure 1 are exactly the same data as used to estimate the regression summary described earlier. How can such an amorphous scatter of points represent a statistically significant relationship? It is the result of a standard assumption of OLS regression: that the explanatory variable(s) X is/are independent of the noise term u.
So long as this independence assumption is true, we can estimate the relationship with surprising precision. To see this, rewrite the conventional t-statistic as, …………… , where ψ is a signal to noise ratio (describing the clarity of the scatter-plot) and N-k is the number of degrees of freedom (Swann, 2012). This formula can be used for bivariate and multivariate models.
In Figure 1, ψ is 0.15, which is quite low, but N-k = 400, which is large enough to make t = 3.0. More generally, even if the signal to noise ratio is very low, so that the relationship between Y and X is imperceptible from a scatter-plot, we can always estimate a significant t-statistic – so long as we have a large enough number of observations, and so long as the independence assumption is true. But there is something doubtful about this ‘significance’.
Is the independence assumption justified? In a context where data are noisy, where rough proxy variables are used, where endogeneity is pervasive, and so on, it does seem an exceptionally strong assumption.
What happens if we relax the independence assumption? When the signal to noise ratio is very low, the estimated relationship depends entirely on the assumption that replaces it. Swann (2012) shows that the relationship in Figure 1 could indeed be almost anything – depending on what we assume about the noise variable(s).
Some have suggested that this is not a problem in practice, because signal to noise ratios are usually large enough to avoid this difficulty. But, on the contrary, some evidence suggests the problem is generally worse than indicated by Figure 1.
Swann (2012) examined 100 econometric studies taken from 20 leading economics journals, yielding a sample of 2220 parameter estimates and the corresponding signal to noise ratios. Focussing on the parameter estimates that are significant (at the 5% level or better), we find that almost 80% of those have a signal to noise ratio even lower than that in Figure 1.
In summary, it appears that the problem of ‘doubtful significance’ is pervasive. The great majority of ‘significant relationships’ in this sample would be imperceptible from the corresponding scatter-plot. The ‘significance’ indicated by a high t-statistic derives from the large number of observations and the (very strong) independence assumption.
References
Keen S. (2012) “Maths for Pluralist Economics”, World Economics Association Newsletter 2 (1), 10-11
Swann G.M.P. (2012) Doubtful Significance, Working paper available at: https://sites.google.com/site/gmpswann/doubtful-significance
[Editor’s note: If you are interested in this topic, you may also wish to read D.A. Hollanders, “Five methodological fallacies in applied econometrics”, real-world economics review, issue no. 57, 6 September 2011, pp. 115-126, http://www.paecon.net/PAEReview/issue57/Hollanders57.pdf]
From: P.6 of World Economics Association Newsletter 2(2), April 2012 http://www.worldeconomicsassociation.org/files/newsletters/Issue2-2.pdf