Birks – Mankiw 7th edn Chapter 25: Production and Growth
Mankiw, N. G. (2015) Principles of economics (7th ed.) Ch.25
Principles of macroeconomics (7th ed.) Ch.12
Mason, OH: South-Western Cengage Learning
Production and Growth
When reading the chapter, here are some aspects to consider:
1. Mankiw presents a simplified approach to the material standard of living and its value. He relies on per capita GDP as the measure to use, with rate of change in per capita GDP as the measure of growth. He then asserts that higher per capita GDP is good, and that it comes through increased productivity, represented by GDP per worker.
2. Table 1 in the chapter compares real GDP over countries. It is not stated, but the comparisons are based on Purchasing Power Parity (PPP) (mentioned in point 9 of this commentary). If a basket of goods is used across countries, then we might want to consider its suitability for this application. As with any index, including the CPI, we should consider:
- Product differences
- Quality differences
- Taste/circumstance differences (climate, culture)
- Also, different income levels suggest very different purchasing patterns (e.g. proportion spent on basic needs, food, clothing, housing).
PPP is arguably better than exchange rates for comparison across countries, but it is still far from perfect. Also, while PPP gives the relative cost of a specific basket of goods, it does not indicate the effort required to earn that amount (if it is even possible). Nor does it indicate the net benefit from the activity.
Mankiw then talks about poverty and the $2 per day standard. If we are concerned about the relative situation for poor people, perhaps we want a basket of basic needs, but this also varies across countries (note the concept of relative deprivation, where poverty is related to you ability to participate in your society – a moving standard rather than an absolute one). Extreme poverty is defined by the World Bank as $1.25 per day in 2005 prices, with $2 being the average poverty line for developing countries (see: http://web.worldbank.org/WBSITE/EXTERNAL/TOPICS/EXTPOVERTY/EXTPA/0,,contentMDK:20040961~menuPK:435040~pagePK:148956~piPK:216618~theSitePK:430367~isCURL:Y,00.html). The measure is not designed for use in developed countries.
3. There are three pictures in the chapter insert with a heading, “A picture is worth a thousand words”. They are described using data on GDP per capita. First, GDP per capita is not the same as either individual or household income. We do not know how much each household gets in income or through publicly provided services such a health and education. Second, if we are to consider the data as indicative of household income, then we should adjust for the sizes of the households. A common approach is to use an “equivalence scale”. This recognises that, for example, a household of four does not require twice as much as a household of two in order to achieve the same standard of living. A scale that has been used in New Zealand scale is the Jensen Scale, named after the public servant who devised this (and later variants). Hence, we have this table:
| Household Type | Jensen 88 |
| Single Person | 0.65 |
| Single, one child | 0.91 |
| Couple | 1 |
| Couple, one child | 1.21 |
| Couple, two children | 1.41 |
| Couple, three children | 1.58 |
| Couple, four children | 1.75 |
| Three adults | 1.29 |
| Three adults, one child | 1.47 |
(from: http://www.eastonbh.ac.nz/2002/11/household_equivalence_scales/)
4. Look at the UK picture. If you are familiar with the UK, you might note that it is not a typical UK family. It is more likely to be above average, but still middle class, probably with both parents working. If you look carefully at this and the building next door you will see that they are semi-detached houses. Their house is only half of the building. Their boat is in the neighbour’s garden, and you can see the dividing fence if you look carefully. The Mexican family has four children and might have just one income earner. If so, the other parent may be productive in the home, but such activity is not picked up in GDP figures. In fact, increased participation in the workforce can result in more paid jobs for others doing childcare, house cleaning and gardening. Some of the increase in GDP is then a result of the activities being included in the GDP measure whereas beforehand they were not. The Mali household seems to be an extended family, and there could be a lot of productive activity that would not be included in GDP. In addition, countries with a high proportion of children will probably have a smaller proportion of the population in the workforce, which alone would give lower per capita GDP.
5. Mankiw is making comparisons across countries and suggesting that higher per capita incomes are better. This is not inevitable. There are three steps required when drawing comparisons to show advantage or disadvantage to a group:
i) Choose your groups, the one of interest and other(s) against which it is to be compared (Mankiw uses countries).
ii) Select a measure for which values differ over groups (Mankiw is using per capita income across countries adjusted according to PPP).
iii) Interpret differences such that one outcome is favoured over another (Mankiw suggests that higher per capita income is better than lower, but are other things different also, such as pollution levels, leisure time, labour force participation, family size?)
There is another insert with the heading, “Are you richer than the richest American?” It is followed by a more specific question, “How much would someone have to pay you to give up for the rest of your life all the modern conveniences that Rockerfeller lived without?” The framing is significant. It focuses on what you would give up, without mentioning what you might get instead. It is not asking you to compare two societies, fully adjusted to the different circumstances. You would be deprived of things that you currently need to be part of your social circle and participate in society (note relative deprivation above). You are then asked, rhetorically, “Isn’t it fair to say that you are better off than John D Rockerfeller?” You are not really being placed in his shoes (nor are you asked to make the effort, risks and sacrifices that he did to achieve his position).
6. The importance of productivity is linked to one of the ten principles from Chapter 1: “Principle 8: A country’s standard of living depends on its ability to produce goods and services”. We could modify this to replace “able” with “willing and able”. This is used in economics when discussing the size of the labour force. It is not enough that someone be able to do a job, he or she must also be willing to accept the job if offered one. There could be good reasons why someone would not want to undertake paid work, or specific paid work, or full-time rather than part-time work, for example. Similarly, resources could be mined, or a decision could be made to conserve them. Consequently, to rephrase Mankiw, “A country’s standard of living depends on its willingness and ability to produce goods and services”. Its choice might also reflect its preferences over the alternatives. New Zealand has been reluctant to extract many of its available natural resources for environmental reasons, and the UK forgoes growth opportunities through its efforts to maintain its cultural heritage (including old buildings). This suggests that “better” might in part indicate differing priorities.
7. As a general point, traditional teaching of economics would involve specification of assumptions, then analysis of a system or model based on those assumptions. Conclusions are then specific to the model. These may have some relevance to the real world if carefully applied. Greater realism could be achieved through relaxation of the assumptions. Mankiw does not always clearly state when conclusions are based on a model and may not always apply in the real world.
8. The discussion on determinants of productivity is presented in a highly aggregated way. This highlights a concern about aggregates, namely the assumption of homogeneity within the aggregate. Units of physical capital are not all identical, and it may not be possible to simply add to the existing stock used by each worker. Mankiw is really talking in a comparative static sense, whereby you have two situations, one with low K/L and one with high K/L, but in both cases the labour and capital are ideally suited to each other. A worker with 10,000 shovels will not be particularly productive, but suitably trained worker with a mechanical digger will be.
9. The idea that education increases human capital is helpful, but it is not the only objective of education. Also, skills can become redundant. For both human capital and physical capital we can think of a “physical life” and an “economic life”. A new office block may make an existing building redundant, even though it is structurally sound. Shorthand typists are no longer required now we have computers and even speech-recognition software for converting speech to text.
10. Natural resources can be beneficial, but their exploitation can affect the viability of other industries. Note the “Dutch disease”, named after a phenomenon observed in the Netherlands, but also common elsewhere. This refers to the situation where a sector, commonly one based on natural resources (oil or gas as for the Netherlands and the UK, or minerals, as recently in Australia) is booming, pushing up the value of a currency to such an extent that other sectors become uncompetitive. They can also lead to political instability in some countries, as with “blood diamonds”.
11. Concerns about technological knowledge often focus on research and development (R&D). We should also be aware of innovation (the development of marketable products or processes), and diffusion of innovation (the use of new products or processes). A country could be successful without undertaking much costly R&D itself if it is quick in taking advantage of new developments.
12. Mankiw focuses on GDP as a measure of standard of living. In the OECD and elsewhere there has been a lot of work done on other measures of well-being, including the OECD’s Measuring Well-being and Progress. Here is a diagram summarising the OECD approach:
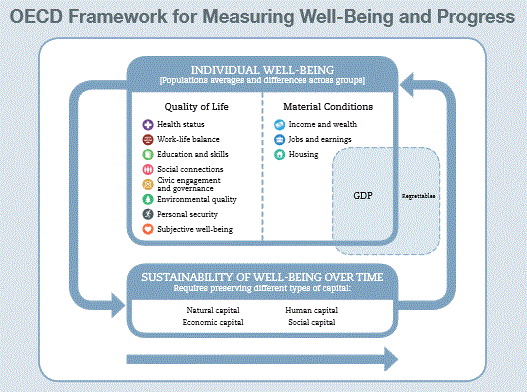
Source: P.4 of http://www.oecd.org/std/Measuring%20Well-Being%20and%20Progress%20Brochure.pdf
13. Mankiw uses Figure 1 in section 3b to describe the catch-up effect, giving this as the explanation for Korea’s per capita GDP growth rate being higher than that of the US. This is based on the evidence being consistent with such an explanation. That should not be taken to mean that the matter is closed. There may be alternative explanations. For example, capital depreciates and so some current investment is simply replacing existing capital equipment rather than increasing the capital stock. If two countries have similar amounts of investment, but one has a larger capital stock, that country will find that more of its investment is replacing current stock. Its stock will therefore be growing more slowly than the other. For another explanation, if technology is improving, new investment will incorporate newer, more productive technology. There could be greater scope for productivity gains in countries with small, less developed existing capital. Advanced countries may already be using recent technology in large quantities, so the available gains are less.
14. We should not assume that Figure 1 accurately reflects the situation in all countries. There may be developments which are only effective if they are of sufficient size. Consider a road-rail-seaport network, or power supply system. Also poorer countries may not be able to increase capital per worker by the same amount as a rich country, given their lower GDP and savings. New technology may be designed for capital-rich countries, whereas poorer countries may have abundant labour but limited capital. For them, some “intermediate technology” more suited to an intermediate level of capital per worker may be desirable. In other words, capital is not homogeneous, and progress through increasing capital/labour ratios may not be a smooth path. 50 years ago Rostow (1960), talking about developing countries, described “take-off into self-sustained growth”. A country could be in a low-income equilibrium (as with a subsistence economy, for example), or put in place enough investment to transform itself into one that could be internationally competitive at a higher level of income. The transition from one to the other involved a large jump, however.
15. Investment from abroad can bring a number of benefits, including links and access into overseas markets and increased demand for outputs from local suppliers. At the same time, it could be employing scarce local resources or skilled workers, thereby limiting opportunities elsewhere.
16. Studies measuring returns to education commonly estimate average returns, and they have to estimate future earnings differentials, commonly on the basis of existing differentials. On both counts this could be misleading. Returns are not identical for all, and additional (marginal?) students may not get the same return. This is especially so if the decision to study is also based in part on ability levels. Also existing pay differentials for skill may bear little relationship to future differentials, especially as skill levels and types change so much over time.
Rostow, W. W. (1960). The stages of economic growth. Cambridge [Eng.]: University Press.
Commentary by Stuart Birks, 1 September 2014